XMM-Newton EPIC-pn Spectrum of NGC 2392
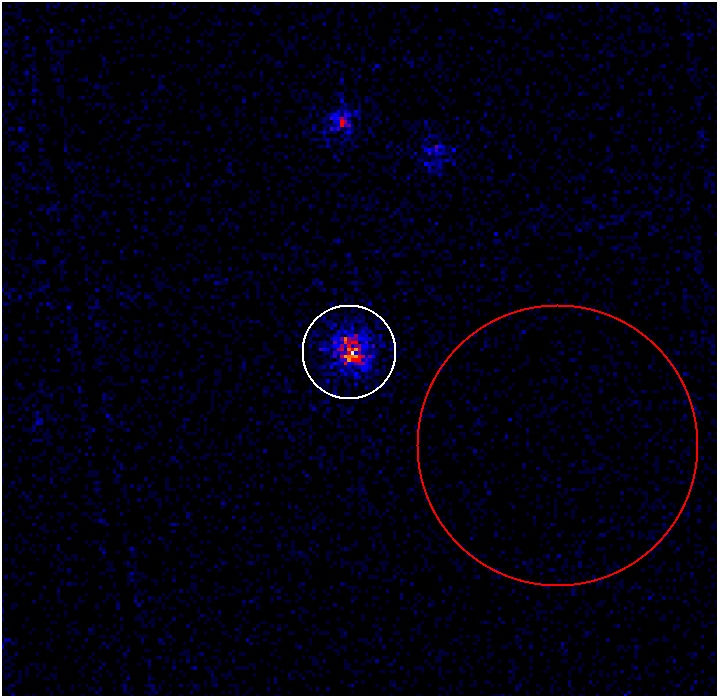
The images show the regions used to extract source and background spectra:
- White regions define the sources.
- Red regions define the background areas whose spectrum was subtracted to
the source spectrum.
The spectra and calibration files used in this analysis can be downloaded from
here in a 4.3 MB tar file.
- The X-ray fluxes are derived from the spectral models with the best statistical fit.
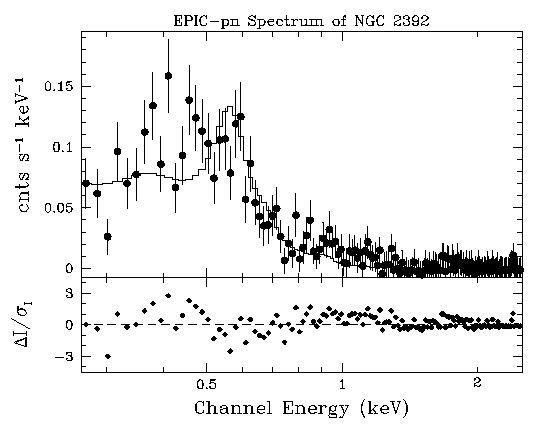
The XMM-Newton EPIC-pn spectrum of NGC 2392 has been fitted using different optically thin
plasma emission models, including:
- A single plasma emission model with nebular abundances.
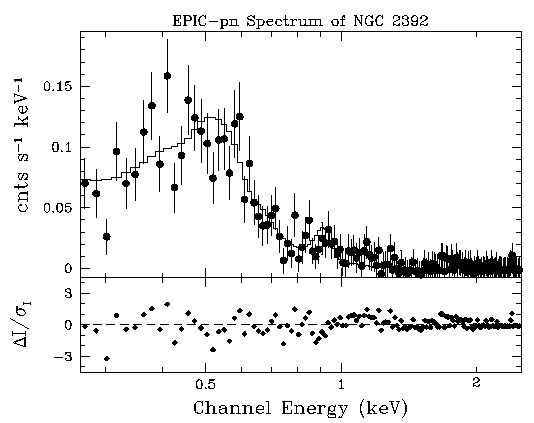
- A single plasma emission model with modified nebular abundances allowing N and Ne to vary.
The plasma emission model with nebular abundances shows systematic deviations, which are removed
by allowing N and Ne to vary.
The abundances of N and Ne in the best-fit models suggest that the X-ray-emitting gas has enhanced N
and Ne abundances with respect to the nebular abundances.
Source and background regions used for the nebular spectrum.
One thermal component with nebular abundances.
Reduced χ2 = χ2/DoF = 75.4/35 = 2.2
kT = 0.168 keV
NH = 5.1×1020 cm−2
One thermal component with N and Ne enhanced nebular abundances.
Reduced χ2 = χ2/DoF = 49.9/33 = 1.5
kT = 0.175 keV
NH = 4.1×1021 cm−2
N = 3.7×Nneb
Ne = 4.7×Neneb
Absorbed flux:
fabs (0.25−2.5 keV) = 5.8×10⁻¹⁴ ergs cm−2 s−1
fabs (0.45−2.5 keV) = 3.9×10⁻¹⁴ ergs cm−2 s−1
Unabsorbed flux:
FX (0.25−2.5 keV) = 8.6×10⁻¹⁴ ergs cm−2 s−1
FX (0.45−2.5 keV) = 4.8×10⁻¹⁴ ergs cm−2 s−1
Luminosity:
LX (0.25−2.5 keV) = 1.4×1031 ergs s−1
LX (0.45−2.5 keV) = 7.7×1030 ergs s−1